Front-end dev
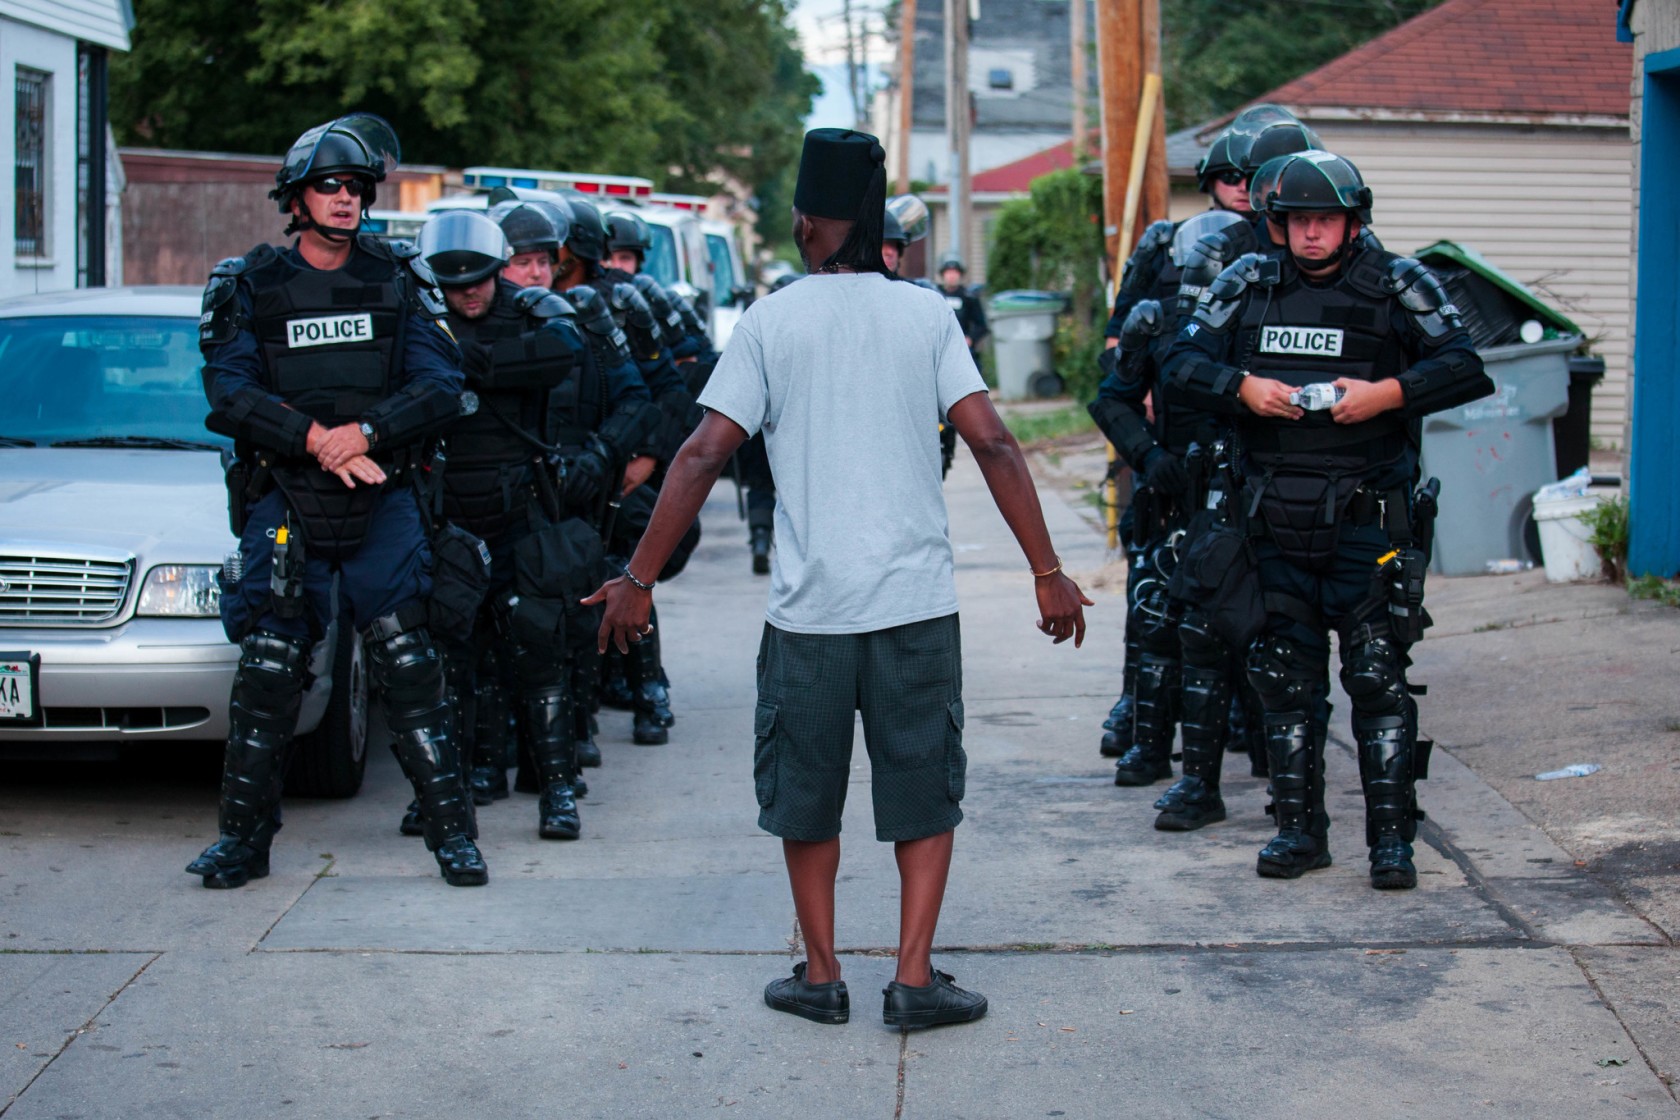
In 2015, The Washington Post began tracking more than a dozen details about each killing — including the race of the deceased, the circumstances of the shooting, whether the person was armed and whether the victim was experiencing a mental-health crisis — by pulling local news reports, law enforcement websites and social media and by monitoring independent databases such as Killed by Police and Fatal Encounters. The Post is documenting only those shootings in which a police officer, in the line of duty, shot and killed a civilian — the circumstances that most closely parallel the 2014 killing of Michael Brown in Ferguson, Missouri, which began the protest movement culminating in Black Lives Matter and an increased focus on police accountability nationwide. The Post is not tracking deaths of people in police custody, fatal shootings by off-duty officers or non-shooting deaths.
The FBI and the Centers for Disease Control and Prevention log fatal shootings by police, but officials acknowledge that their data is incomplete. In 2015, The Post documented more than two times more fatal shootings by police than had been recorded by the FBI. According the Las Vegas Review-Journal: Deadly Force, "The nation’s leading law enforcement agency [FBI] collects vast amounts of information on crime nationwide, but missing from this clearinghouse are statistics on where, how often, and under what circumstances police use deadly force. In fact, no one anywhere comprehensively tracks the most significant act police can do in the line of duty: take a life." In hopes to be more informed on this matter, I would like to investigate:
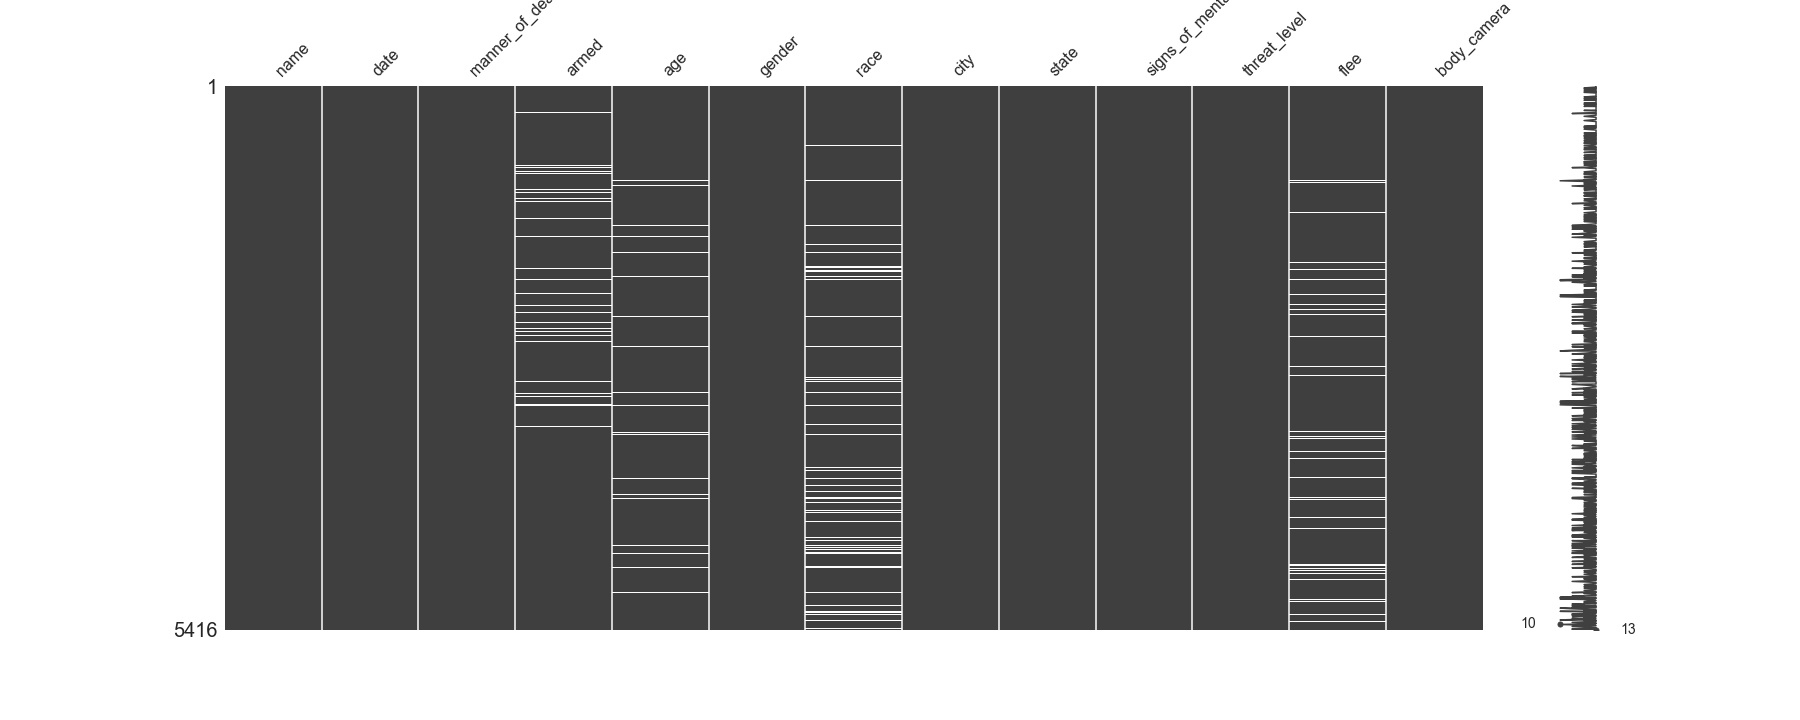
Given the current climate on police brutality, it's concerning that race has the most null values. This further compounds the fact law enforcement agencies are purposely hiding race to deflate actual data trends. Since each column with null values is less than 10% then we can continue with dropping those rows since it wont significantly impact the analysis.
For more detailed cleaning, please view my Jupyter notebook in my Github repo. https://github.com/aclao89/Police_Shootings
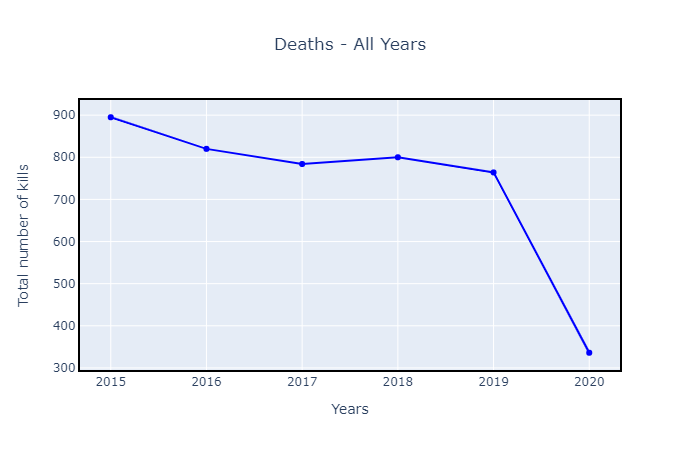
This graph shows that the rate of killing per year has never looked down except 2017. It has an average of 800 per year. We are in mid of 2020 and we have already reached ~350 death counts as of now. Will this year also be the same story as before?
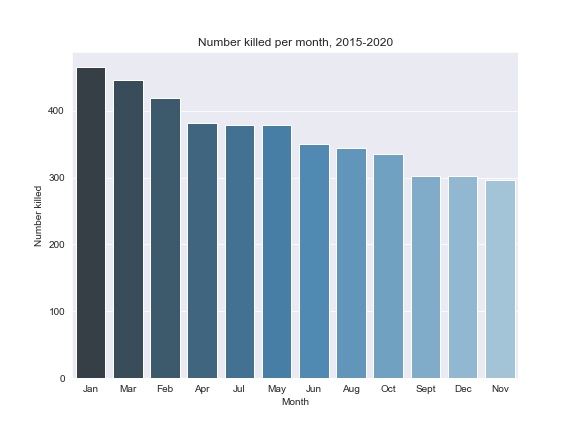
January, February and March have recorded most cases, averaging well over 400 per month. That is approximately 13 deaths every day! :(
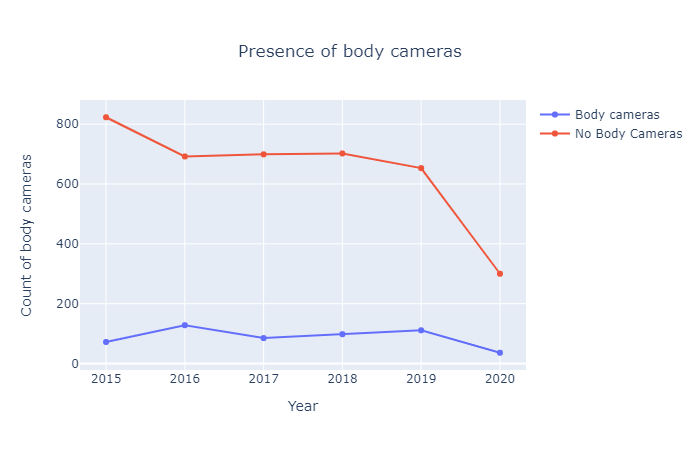
Due to the 2014 slaying of Michael Brown, the Department of Justice launched a campaign to increase police accountability through body cameras. However, the data tells a different story; more than 85% of cases per year had no body cameras to documentation and accountability. This needs immediate change since law enforcement are suppose to serve and protect while providing transparency around its actions and tactics. The lack of body cameras is astounding and provides the need of police accountability and restructuring to ensure transparency. If the police is abiding by trained tactics and conduct, then they should have nothing to hide from a body camera. In 2014, researchers at Arizona State University (funded through the Bureau of Justice Assistance’s Smart Policing Initiative) found that officers with body-worn cameras were more productive in terms of making arrests, had fewer complaints lodged against them relative to officers without body-worn cameras, and had higher numbers of citizen complaints resolved in their favor
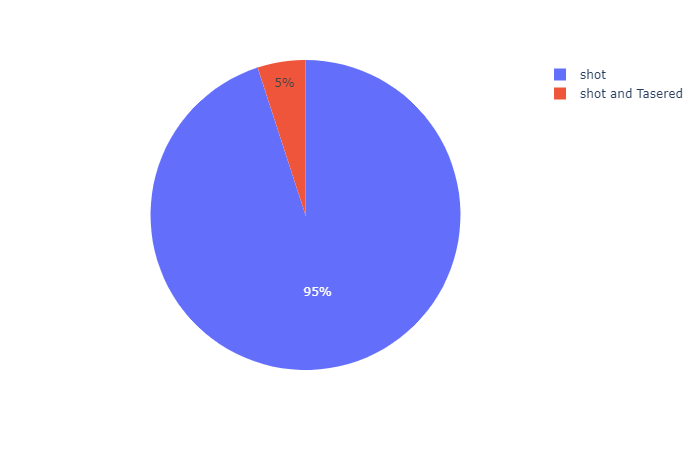
According to this policy, the primary purpose for employing the Taser is to protect human lives and prevent injury to officers and citizens. Since it's less lethal, we can assume that a taser was deployed as a first sign of warning toward the aggressor. Only 5% of cases had a taser deployed then subsequently shot. On the contrary, 95% of cases were just shot. This calls into question on police tactics and funding. This metric can be used to formulate mandatory tactical self-defense skill as a less-lethal approach to subdue/deescalate situations to reduce deaths.
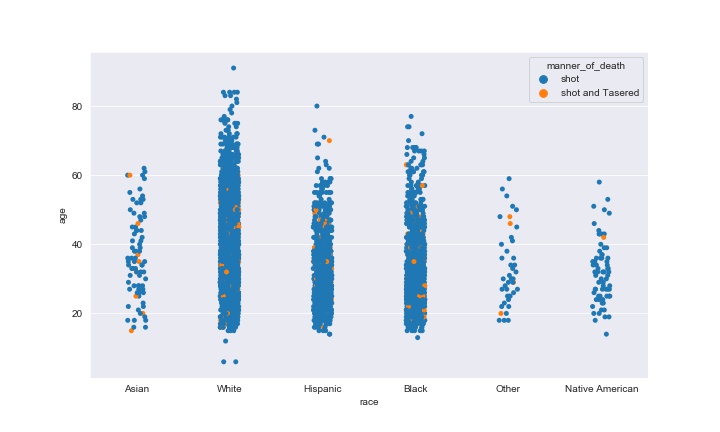
No significant difference among the racial groups. Since only 5% were tasered and shot, it seems evenly distributed amongst the groups.
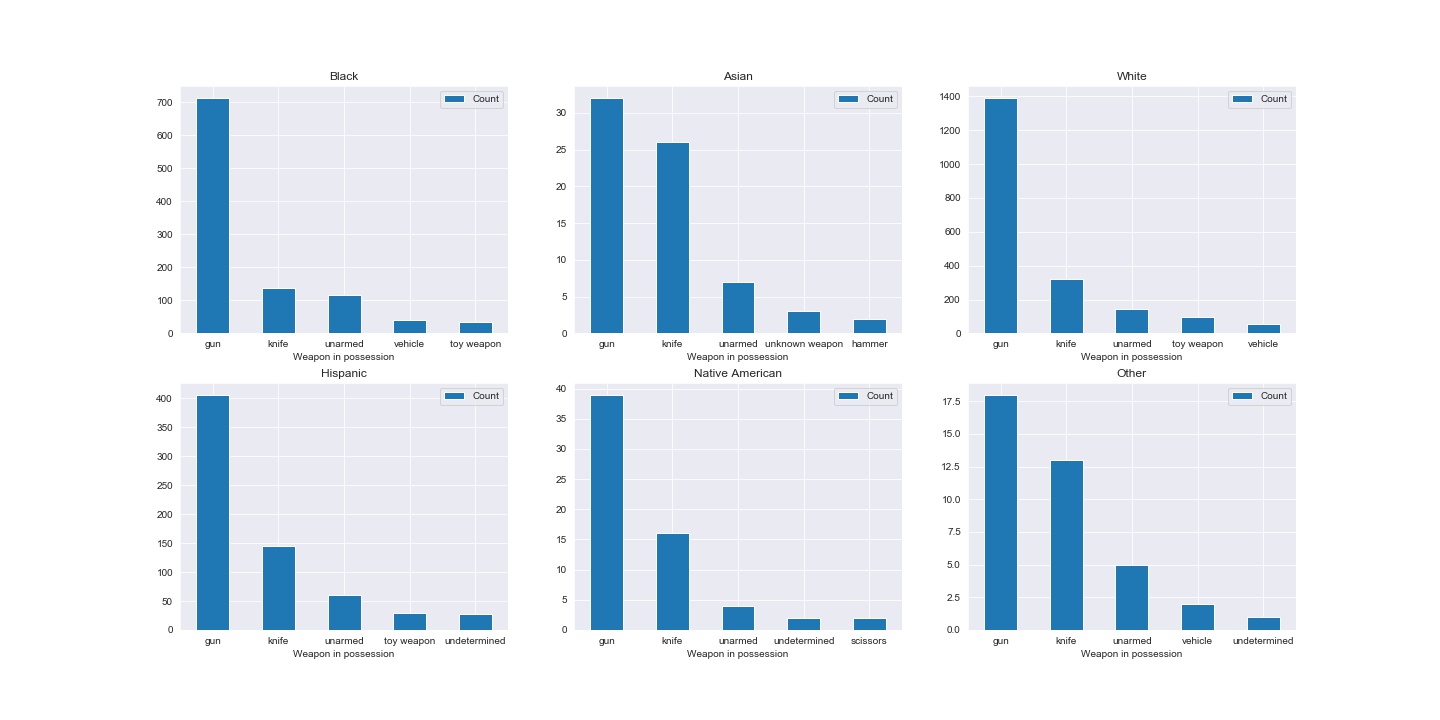
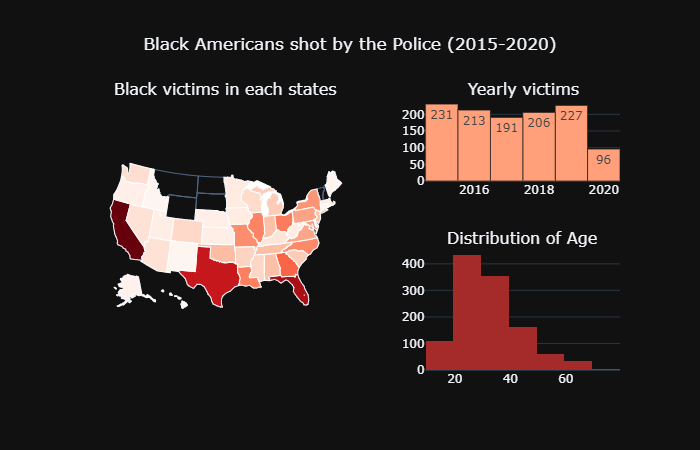
Obviously, a gun is a commonly used weapon and also considered an immediate threat to law enforcement. However, unarmed African Americans are shot at a higher rate than any other race. One might argue that unarmed does not equate to less threat which is true. This call into question regarding police accurately assessing threat levels and tactics to subdue the perp instead of killing.
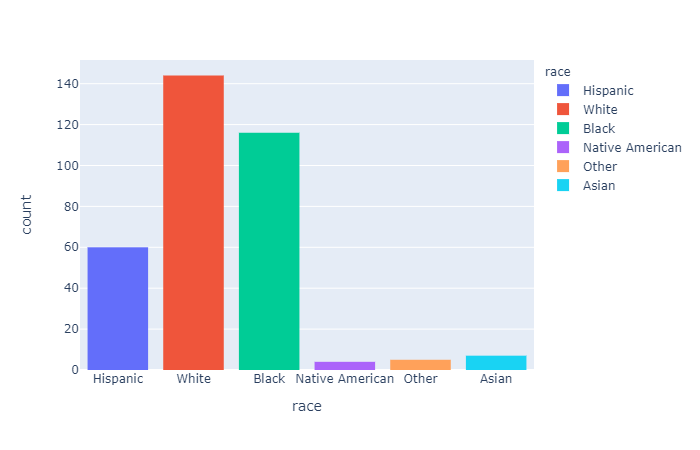
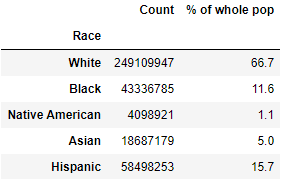
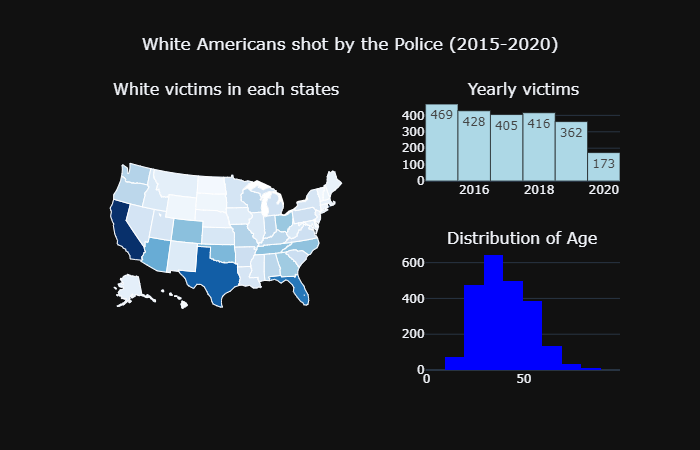
At first glance, Whites were shot at an astonishing rate of 51%. However, this should be taken with a grain of salt since White Americans comprise two-thirds of the US total population. African Americans, however, account for 26% of those fatally shot and killed by the police despite being just 12% of the U.S. population.
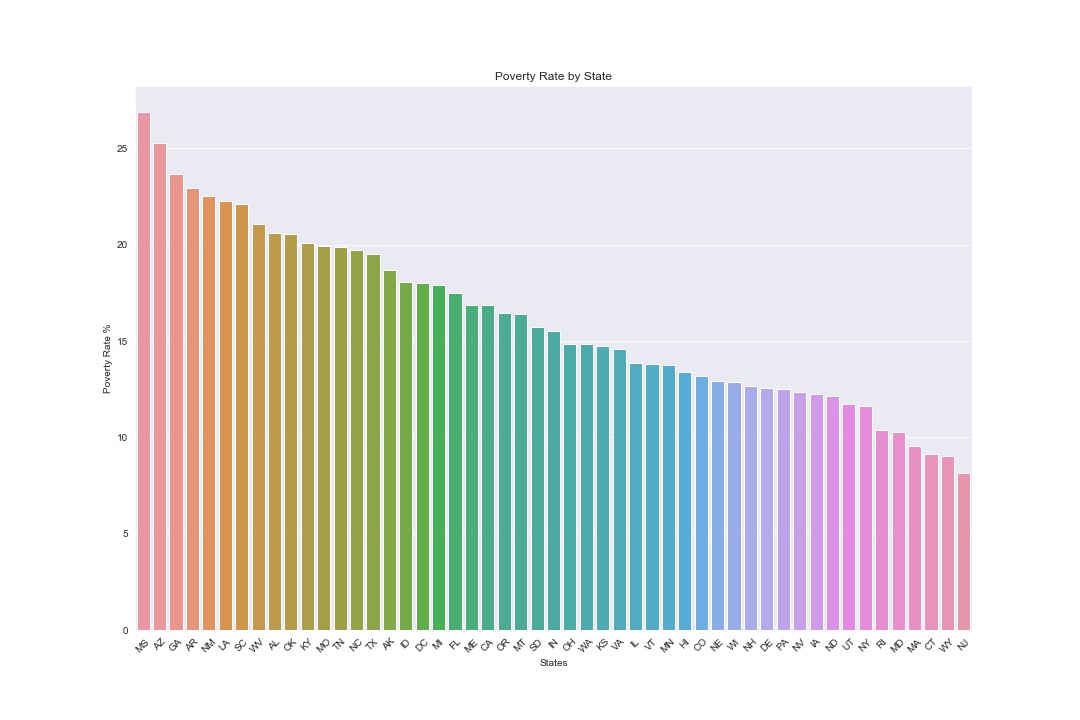
Twenty five of the population of Mississippi and Arizona are below the poverty rate.
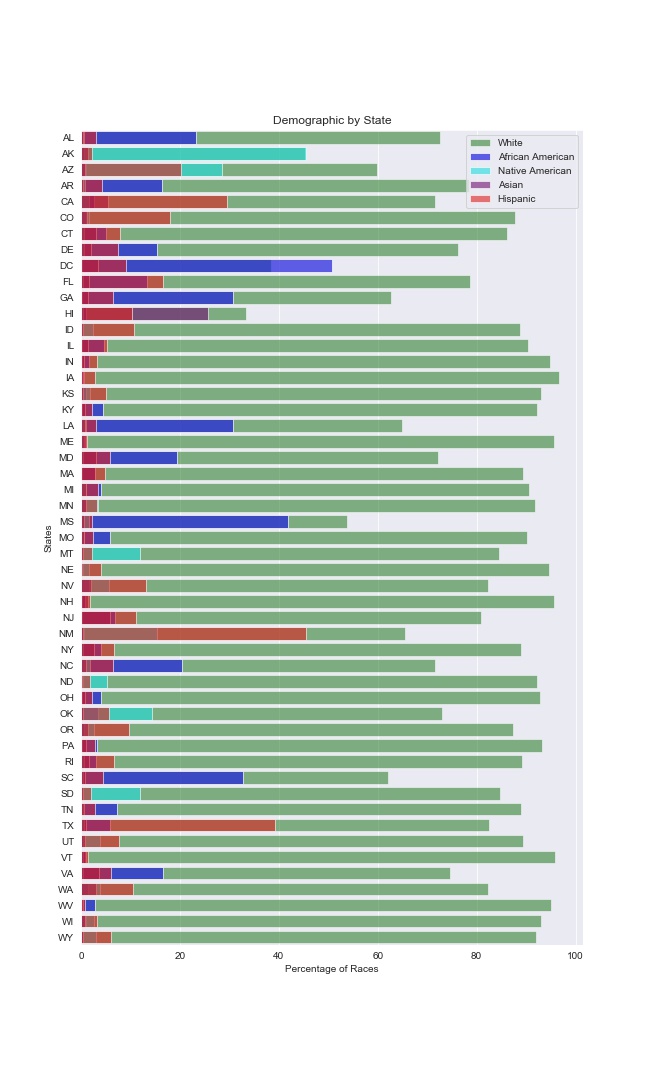
Mississippi has the second highest African American population behind Washington DC. Crime and poverty are often correlated; One way poverty causes crime is the way most people think of it: Some people in desperate need of money commit crimes.