Data Analyst

Netflix originally started as a DVD sales and rental by mail then switched to focus on the DVD rental business. In 2007, Netflix expanded their business with streaming media. Netflix is an application that keeps growing up the graph with its popularity, shows and content. Disney + launched the subscription video on-demand streaming service on November 12, 2019, in the United States, Canada, and the Netherlands. The service was expanded to Australia, New Zealand, and Puerto Rico a week later, and expanded to select European countries on March 24, 2020. IMDb is an online database of information related to films, television programs, home videos, video games, and streaming content online – including cast, production crew and personal biographies, plot summaries, trivia, ratings, and fan and critical reviews. This project is an Exploratory Data Analysis (EDA) of each streaming service, differences, similarities, and ratings distribution of content between the platforms.
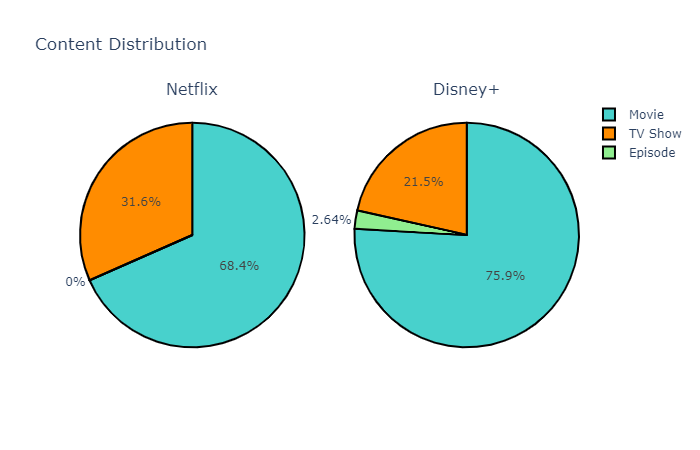
Movies takes up more than 50% of the content for both services. Interestingly, Disney + has stand-alone episodes, commonly produced by Disney, a service not performed by Netflix.
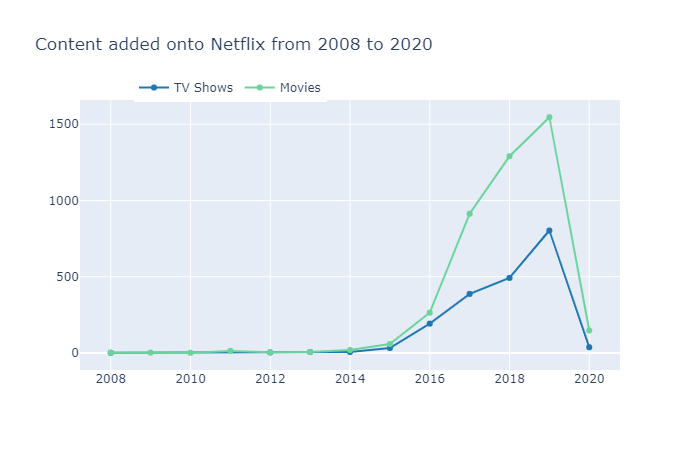
Netflix is continuously adding content every year. Movies have a larger presence than TV shows. In 2019, at least half of the listings were TV shows. The rise and popularity of TV shows can be attributed to the potential for extended narratives which a 2-2.5 hour movie may not fulfill. This is an interesting area that requires more data to gain insight. Additionally, the low amount of content from 2008 to 2014 needs to be further investigated. https://www.investopedia.com/articles/markets/051215/who-are-netflixs-main-competitors-nflx.asp
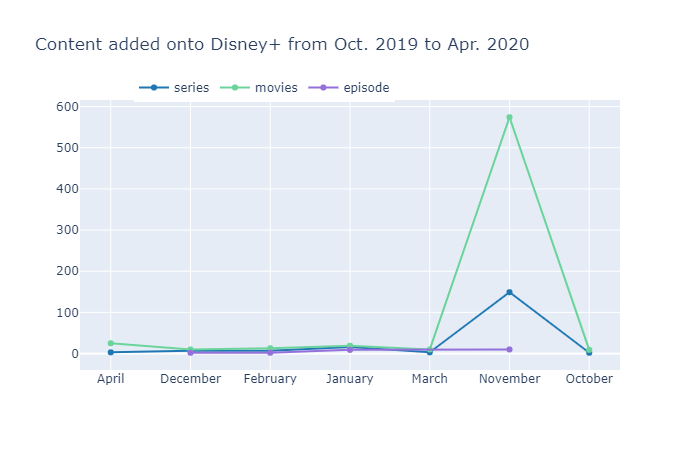
Disney + officially launched in the United States on November 12, 2019. This explains the intial surge in content added. However, it was interesting to see that some content was added in early October 2019, which was more than a month prior to the official release date. This could be a mistake in the data entry process.
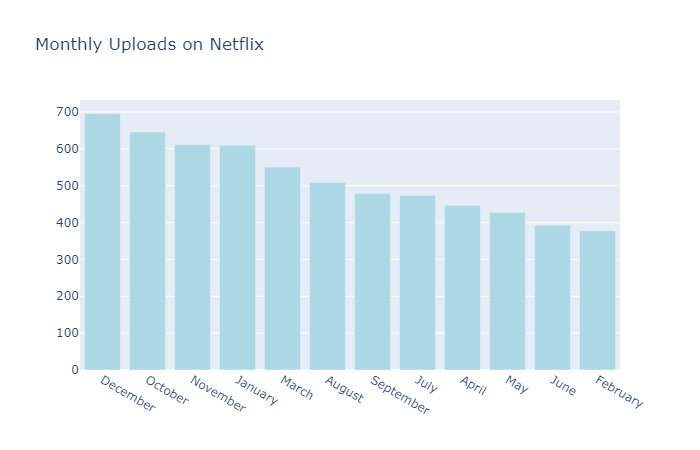
Netflix tends to release content during the fall months especially during onset of holiday season from Thanksgiving to Christmas. Since a majority of people will be with their families or on holiday vacation, it is the optimal time to release content for viewership.
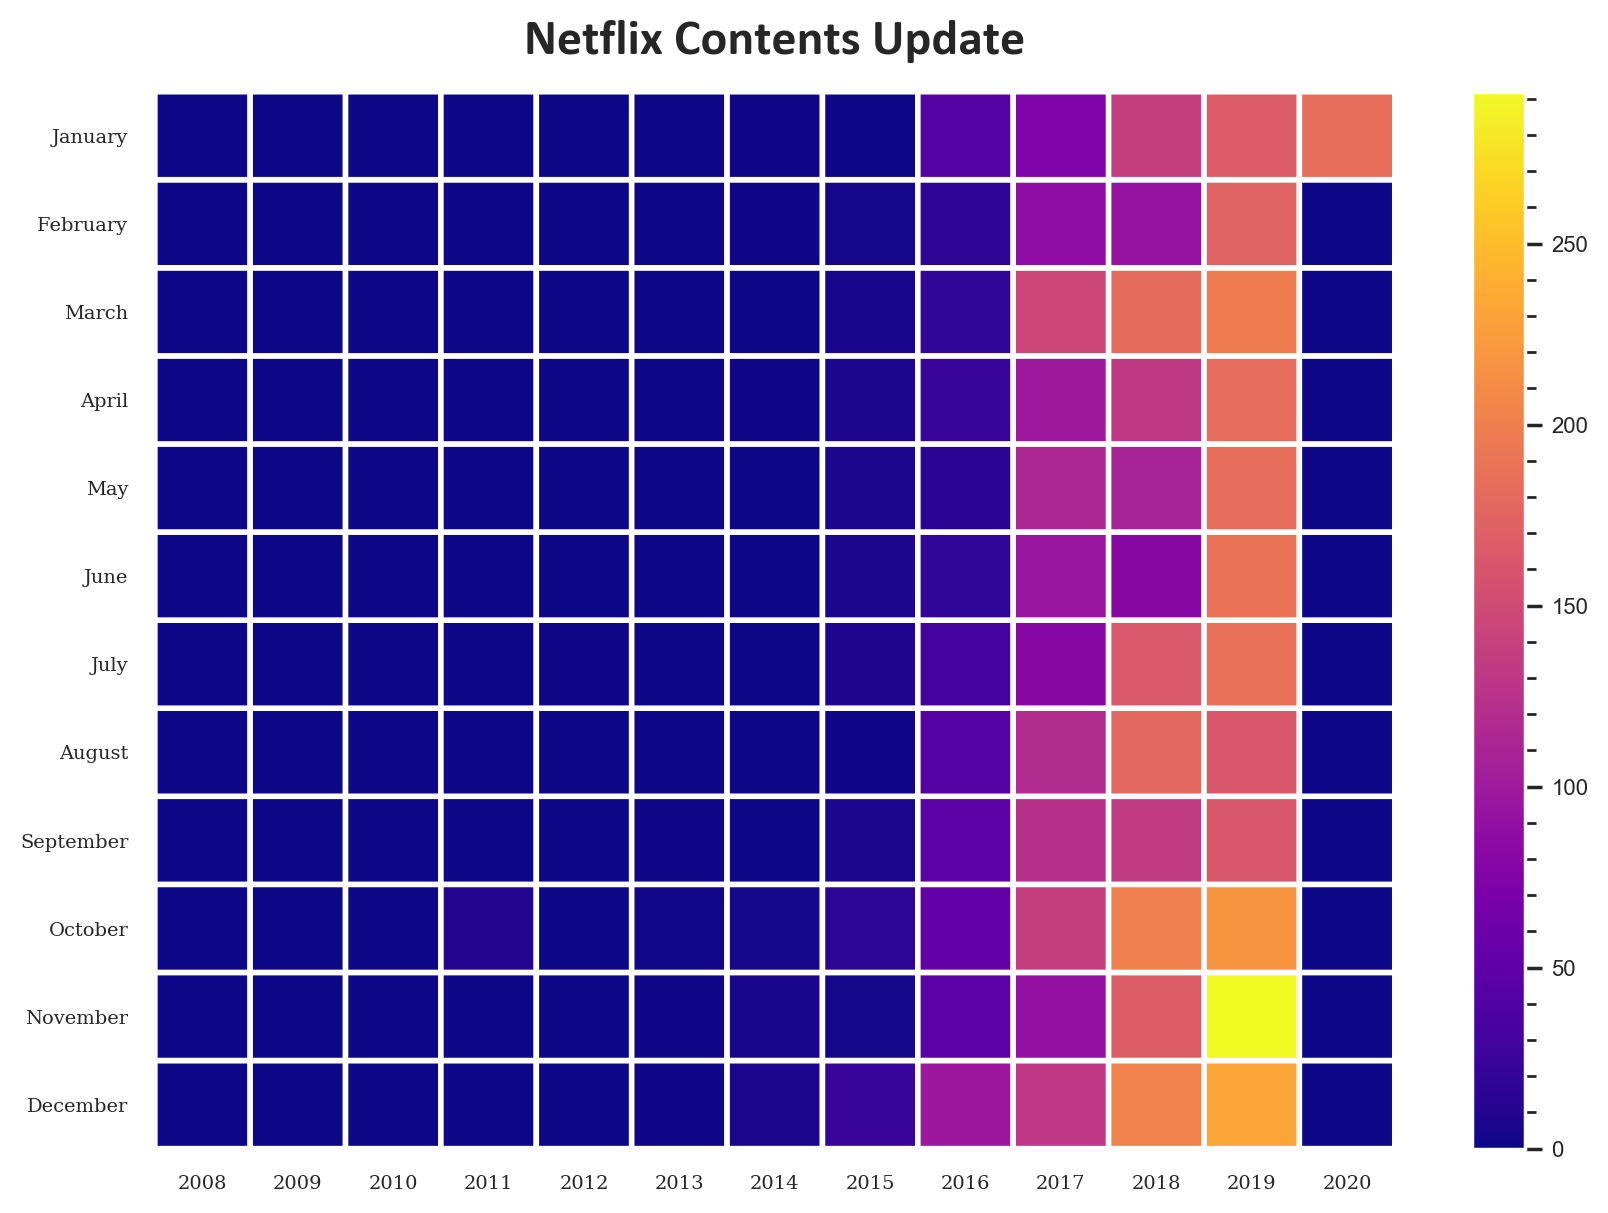
I would focus on any of the months with purple and magenta. The orange and yellow indicate high volume of content so viewership may go down for certain releases.
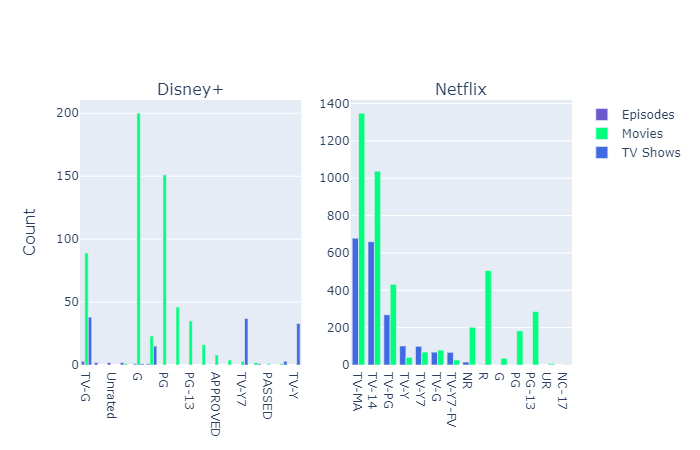
Most of the content is rated TV-MA, TV-14 and TV-PG. We can deduce that Netflix's customer base are older adults. Programming rated TV-MA in the United States by the TV Parental Guidelines signifies content for mature audiences only. Programs with this rating are usually not suitable for anyone under 17 years of age (under 18 or 21 in some networks/services). Content may contain strong coarse language, explicit (in some cases, pornographic) strong sexual content, nudity, or intense/graphic violence.
Disney+ focuses on family-oriented entertainment and features no R and NC-17 rated films and TV-MA shows.
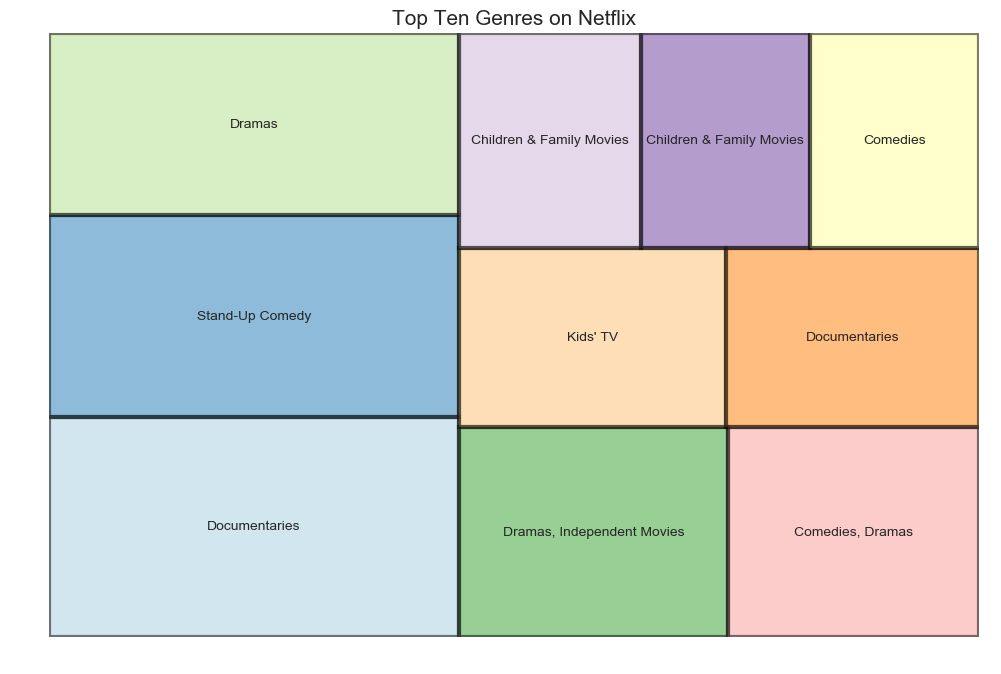
Comedies and documentaries are most popular genres on Netflix.
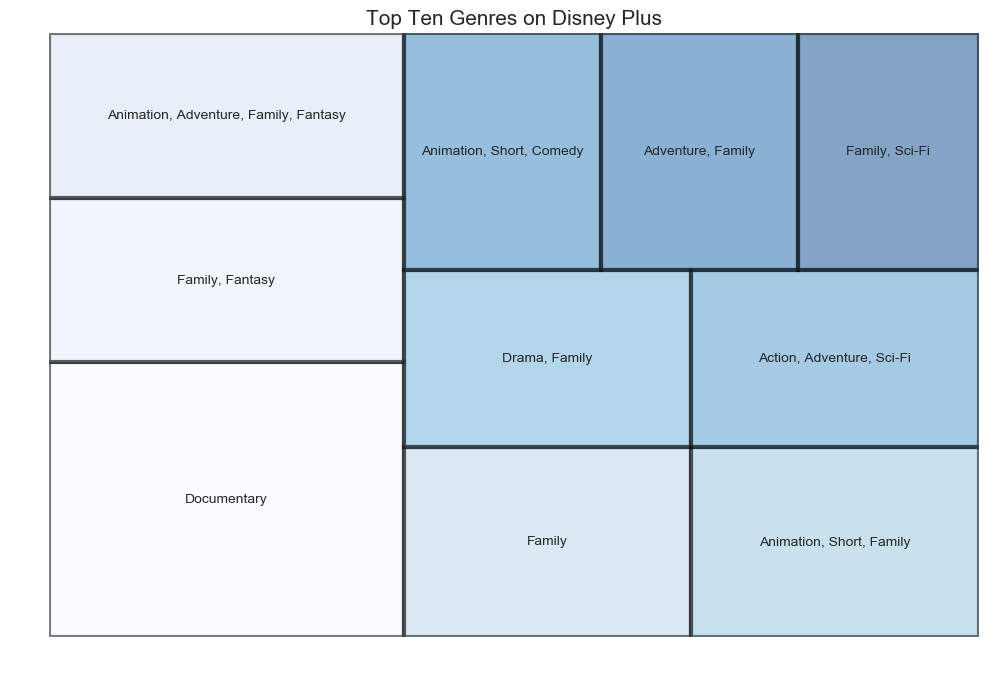
Seven out of the top ten genres are family-oriented. This is no surprise since majority of movies and TV shows are from Disney, Pixar, Marvel, Star Wars, and National Geographic. All these studio productions are catered to children and young teens.

'Man' appeared the most with 185 mentions followed by 'love' with 135.
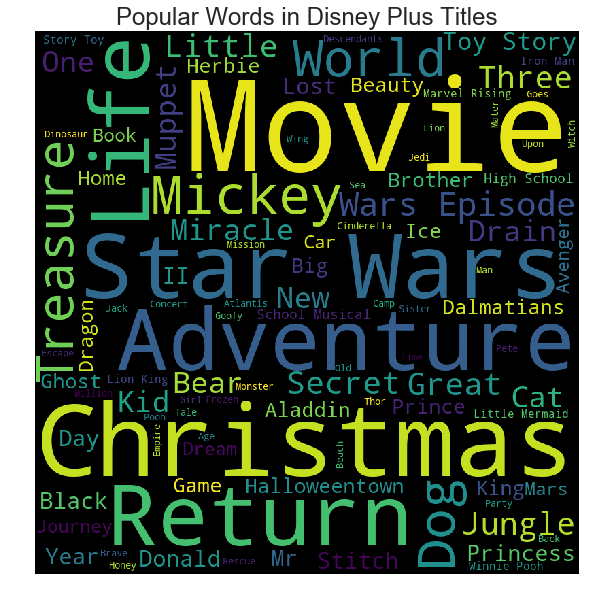
"Star Wars" has the most mentions at 22 followed by "Movie" at 18. Star Wars is a popular show amongst kids and young teens. Movie is often included in the descriptions of family movies.
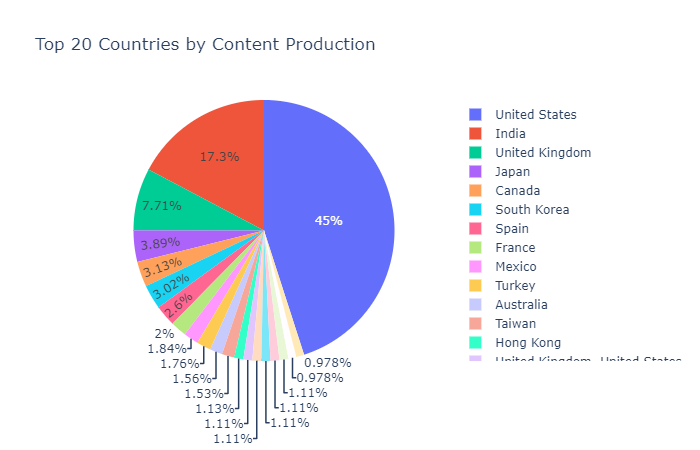
Netflix is an American media-services provider and production company headquartered in Los Gatos, California. It's not surprising that 45% of content was produced in the United States. India has the second biggest share at 17.3%.